Mogwai Method with RSI and EMA - BTCUSD 15mThis is a custom TradingView indicator designed for trading Bitcoin (BTCUSD) on a 15-minute timeframe. It’s based on the Mogwai Method—a mean-reversion strategy—enhanced with the Relative Strength Index (RSI) for momentum confirmation. The indicator generates buy and sell signals, visualized as green and red triangle arrows on the chart, to help identify potential entry and exit points in the volatile cryptocurrency market.
Components
Bollinger Bands (BB):
Purpose: Identifies overextended price movements, signaling potential reversions to the mean.
Parameters:
Length: 20 periods (standard for mean-reversion).
Multiplier: 2.2 (slightly wider than the default 2.0 to suit BTCUSD’s volatility).
Role:
Buy signal when price drops below the lower band (oversold).
Sell signal when price rises above the upper band (overbought).
Relative Strength Index (RSI):
Purpose: Confirms momentum to filter out false signals from Bollinger Bands.
Parameters:
Length: 14 periods (classic setting, effective for crypto).
Overbought Level: 70 (price may be overextended upward).
Oversold Level: 30 (price may be overextended downward).
Role:
Buy signal requires RSI < 30 (oversold).
Sell signal requires RSI > 70 (overbought).
Exponential Moving Averages (EMAs) (Plotted but not currently in signal logic):
Purpose: Provides trend context (included in the script for visualization, optional for signal filtering).
Parameters:
Fast EMA: 9 periods (short-term trend).
Slow EMA: 50 periods (longer-term trend).
Role: Can be re-added to filter signals (e.g., buy only when Fast EMA > Slow EMA).
Signals (Triangles):
Buy Signal: Green upward triangle below the bar when price is below the lower Bollinger Band and RSI is below 30.
Sell Signal: Red downward triangle above the bar when price is above the upper Bollinger Band and RSI is above 70.
How It Works
The indicator combines Bollinger Bands and RSI to spot mean-reversion opportunities:
Buy Condition: Price breaks below the lower Bollinger Band (indicating oversold conditions), and RSI confirms this with a reading below 30.
Sell Condition: Price breaks above the upper Bollinger Band (indicating overbought conditions), and RSI confirms this with a reading above 70.
The strategy assumes that extreme price movements in BTCUSD will often revert to the mean, especially in choppy or ranging markets.
Visual Elements
Green Upward Triangles: Appear below the candlestick to indicate a buy signal.
Red Downward Triangles: Appear above the candlestick to indicate a sell signal.
Bollinger Bands: Gray lines (upper, middle, lower) plotted for reference.
EMAs: Blue (Fast) and Orange (Slow) lines for trend visualization.
How to Use the Indicator
Setup
Open TradingView:
Log into TradingView and select a BTCUSD chart from a supported exchange (e.g., Binance, Coinbase, Bitfinex).
Set Timeframe:
Switch the chart to a 15-minute timeframe (15m).
Add the Indicator:
Open the Pine Editor (bottom panel in TradingView).
Copy and paste the script provided.
Click “Add to Chart” to apply it.
Verify Display:
You should see Bollinger Bands (gray), Fast EMA (blue), Slow EMA (orange), and buy/sell triangles when conditions are met.
Trading Guidelines
Buy Signal (Green Triangle Below Bar):
What It Means: Price is oversold, potentially ready to bounce back toward the Bollinger Band middle line.
Action:
Enter a long position (buy BTCUSD).
Set a take-profit near the middle Bollinger Band (bb_middle) or a resistance level.
Place a stop-loss 1-2% below the entry (or based on ATR, e.g., ta.atr(14) * 2).
Best Context: Works well in ranging markets; avoid during strong downtrends.
Sell Signal (Red Triangle Above Bar):
What It Means: Price is overbought, potentially ready to drop back toward the middle line.
Action:
Enter a short position (sell BTCUSD) or exit a long position.
Set a take-profit near the middle Bollinger Band or a support level.
Place a stop-loss 1-2% above the entry.
Best Context: Effective in ranging markets; avoid during strong uptrends.
Trend Filter (Optional):
To reduce false signals in trending markets, you can modify the script:
Add and ema_fast > ema_slow to the buy condition (only buy in uptrends).
Add and ema_fast < ema_slow to the sell condition (only sell in downtrends).
Check the Fast EMA (blue) vs. Slow EMA (orange) alignment visually.
Tips for BTCUSD on 15-Minute Charts
Volatility: BTCUSD can be erratic. If signals are too frequent, increase bb_mult (e.g., to 2.5) or adjust RSI levels (e.g., 75/25).
Confirmation: Use volume spikes or candlestick patterns (e.g., doji, engulfing) to confirm signals.
Time of Day: Mean-reversion works best during low-volume periods (e.g., Asian session in crypto).
Backtesting: Use TradingView’s Strategy Tester (convert to a strategy by adding entry/exit logic) to evaluate performance with historical BTCUSD data up to March 13, 2025.
Risk Management
Position Size: Risk no more than 1-2% of your account per trade.
Stop Losses: Always use stops to protect against BTCUSD’s sudden moves.
Avoid Overtrading: Wait for clear signals; don’t force trades in choppy or unclear conditions.
Example Scenario
Chart: BTCUSD, 15-minute timeframe.
Buy Signal: Price drops to $58,000, below the lower Bollinger Band, RSI at 28. A green triangle appears.
Action: Buy at $58,000, target $59,000 (middle BB), stop at $57,500.
Sell Signal: Price rises to $60,500, above the upper Bollinger Band, RSI at 72. A red triangle appears.
Action: Sell at $60,500, target $59,500 (middle BB), stop at $61,000.
This indicator is tailored for mean-reversion trading on BTCUSD. Let me know if you’d like to tweak it further (e.g., add filters, alerts, or alternative indicators)!
Cerca negli script per "relative strength"

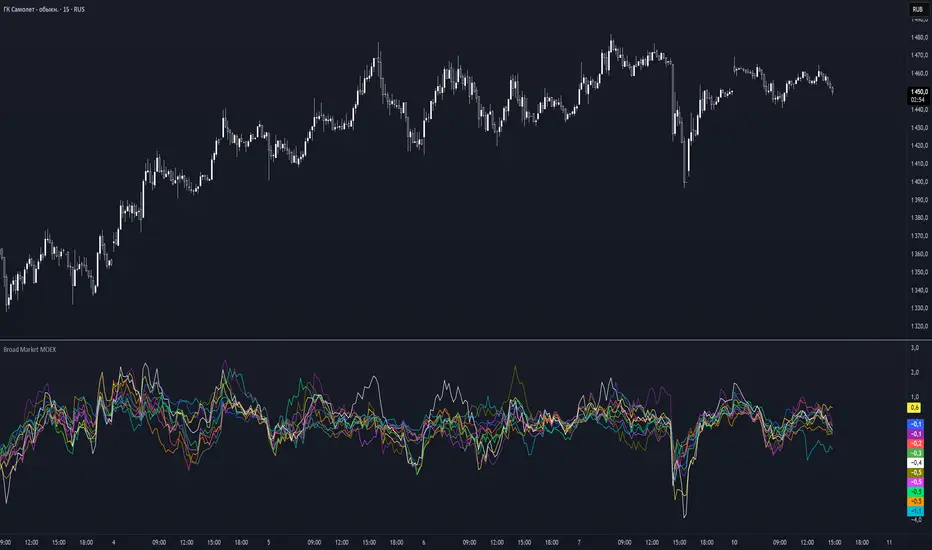
Broad Market MOEX### **Broad Market for Russia**
The **Broad Market for Russia** indicator provides a comparative analysis of the price deviation of major Russian stocks relative to their average closing price over a customizable lookback period. This tool helps traders identify market trends and detect relative strength or weakness among different assets.
### **How It Works:**
- The indicator calculates the **percentage deviation** of each stock’s current price from its **simple moving average (SMA)** over the defined **lookback period (in hours).**
- The **default lookback period is 24 hours**, but it can be adjusted based on the trader’s needs.
- It tracks major Russian assets, including **Gazprom, Sberbank, Lukoil, Rosneft, Norilsk Nickel, Yandex, and others**, alongside the currently selected instrument.
- Each stock’s deviation is plotted on a separate panel, allowing for quick visual comparison.
- **Positive deviation** indicates that the price is trading above its average, signaling potential **bullish momentum**.
- **Negative deviation** suggests the price is below its average, possibly indicating **bearish conditions**.
This indicator is particularly useful for traders in the Russian stock market who want to gauge broader market strength and detect divergence patterns across multiple assets.
---
### **Broad Market for Russia**
Индикатор **Broad Market for Russia** предоставляет сравнительный анализ отклонения цены крупнейших российских акций относительно их среднего значения за настраиваемый период. Этот инструмент помогает трейдерам выявлять рыночные тренды и определять относительную силу или слабость активов.
### **Как это работает:**
- Индикатор рассчитывает **процентное отклонение** текущей цены каждой акции от её **простого скользящего среднего (SMA)** за заданный **период анализа (в часах).**
- **Период анализа по умолчанию — 24 часа**, но его можно изменять в зависимости от предпочтений трейдера.
- В индикаторе отслеживаются **крупнейшие российские активы**, такие как **Газпром, Сбербанк, Лукойл, Роснефть, Норникель, Яндекс и другие**, а также текущий выбранный инструмент.
- Отклонение каждой акции отображается на отдельной панели, что позволяет быстро проводить визуальное сравнение.
- **Положительное отклонение** означает, что цена торгуется выше своего среднего значения, что может сигнализировать о **бычьем тренде**.
- **Отрицательное отклонение** указывает, что цена ниже своего среднего значения, что может свидетельствовать о **медвежьей тенденции**.
Этот индикатор особенно полезен для трейдеров российского фондового рынка, которые хотят оценить силу всего рынка и выявлять расхождения между различными активами.
Broad Market for Crypto**Broad Market for Crypto** indicator provides a comparative analysis of the price deviation of multiple major cryptocurrencies relative to their average closing price over a customizable lookback period. This tool helps traders identify market trends and spot relative strength or weakness among different assets.
### **How It Works:**
- The indicator calculates the percentage deviation of each cryptocurrency’s current price from its simple moving average (SMA) over the defined **lookback period (in hours).**
- The **default lookback period is 24 hours**, but it can be adjusted according to the trader's preference.
- It tracks major crypto assets, including **BTC, ETH, BNB, SOL, XRP, ADA, AVAX, LINK, DOGE, and TRX**, alongside the currently selected instrument.
- Each cryptocurrency’s deviation is plotted on a separate panel, allowing for quick visual comparison.
- Positive deviation indicates that the price is trading above its average, signaling potential bullish momentum.
- Negative deviation suggests the price is below its average, possibly indicating bearish conditions.
This indicator is particularly useful for crypto traders who want to gauge the broader market’s strength and detect divergence patterns across multiple assets.
---------------------------------------------------------------------------------
**Broad Market for Crypto - Описание индикатора**
Индикатор **Broad Market for Crypto** предоставляет сравнительный анализ отклонения цены различных крупных криптовалют относительно их среднего значения за настраиваемый период. Этот инструмент помогает трейдерам выявлять рыночные тренды и определять относительную силу или слабость активов.
### **Как это работает:**
- Индикатор рассчитывает **процентное отклонение** текущей цены каждой криптовалюты от её **простого скользящего среднего (SMA)** за заданный **период анализа (в часах)**.
- **Период анализа по умолчанию — 24 часа**, но его можно изменять в зависимости от предпочтений трейдера.
- В индикаторе отслеживаются основные криптоактивы: **BTC, ETH, BNB, SOL, XRP, ADA, AVAX, LINK, DOGE и TRX**, а также текущий выбранный инструмент.
- Отклонение каждой криптовалюты отображается на отдельной панели, что позволяет быстро проводить визуальное сравнение.
- **Положительное отклонение** означает, что цена торгуется выше своего среднего значения, что может сигнализировать о **бычьем тренде**.
- **Отрицательное отклонение** указывает, что цена ниже своего среднего значения, что может свидетельствовать о **медвежьей тенденции**.
Этот индикатор особенно полезен для криптотрейдеров, желающих оценить силу всего рынка и выявлять расхождения между различными активами.

aivance_Multi-Index Performance Comparison# Multi-Index Performance Comparison
This indicator allows traders and investors to easily compare the performance of multiple global market and sector indexes from a user-defined start date. All indexes are normalized to 100% at the specified start date, making relative performance comparisons straightforward.
## Features:
- Customizable start date for performance comparison
- Toggleable global market indexes (S&P 500, MSCI World, DAX, Nasdaq 100, EURO STOXX 50, Japan, Hong Kong)
- Toggleable sector indexes (Materials, Health Care, Financial, Technology, AI & Robotics)
- Clear visualization with distinct colors for each index
- Reference line at 100% for easy benchmark comparison
## How to Use:
1. Set your desired start date for normalizing performance
2. Toggle indexes on/off under the "Inputs" tab
3. Compare relative performance across different markets and sectors
Perfect for identifying relative strength, sector rotation, or global market correlations over your specific timeframe of interest.

Advanced Candlestick Pattern DetectorWhat Does This Indicator Do?
This indicator looks at the way price moves in the market using candlesticks (those red and green bars you see on charts). It tries to find special patterns like Bullish Engulfing, Hammer, Doji, and others. When one of these patterns shows up, the indicator checks a bunch of filters to decide if the pattern is strong enough to be a signal to buy or sell.
The Main Parts of the Indicator
1. Candlestick Pattern Detection
Bullish Engulfing:
Imagine you see a small down candle (red) and then a big up candle (green) that completely “covers” the red one. That’s a bullish engulfing pattern. It can signal that buyers are taking over.
Bearish Engulfing:
The opposite of bullish engulfing. A small up candle (green) is followed by a big down candle (red) that covers the previous candle. This suggests sellers might be in control.
Hammer & Shooting Star:
Hammer: A candle with a very short body and a long shadow at the bottom. It shows that buyers stepped in after a drop.
Shooting Star:
Similar to the hammer but with a long shadow on top. It can indicate that sellers are starting to push the price down.
Doji:
A candle with almost no body. This means the opening and closing prices are very close. It shows indecision in the market.
Harami Patterns (Bullish & Bearish):
These are two-candle patterns where the second candle is completely inside the body of the first candle. They signal that the previous trend might be about to change.
Morning Star & Evening Star:
These are three-candle patterns.
Morning Star:
Often seen at the bottom of a downtrend, it can signal a reversal to an uptrend.
Evening Star:
Seen at the top of an uptrend, it can signal that the price may soon go down.
2. Filters: Making the Signals Smarter
The indicator doesn’t just rely on patterns. It uses several “filters” to decide if a pattern is strong enough to trade on. Here’s what each filter does:
a. Adaptive Thresholds (ATR-Based)
What It Is:
The indicator uses something called ATR (Average True Range) to see how much the price is moving (volatility).
How It Works:
Instead of using fixed numbers to decide if a candle is a Hammer or a Doji, it adjusts these numbers based on current market activity.
User Settings:
Use Adaptive Thresholds: Turn this on to let the indicator adjust automatically.
Body Factor, Shadow Factor, Doji Factor: These numbers are multipliers that decide how small or big the body and shadows of the candle should be. You can change them if you want the indicator to be more or less sensitive.
b. Volume Filter
What It Is:
Volume shows how many trades are happening.
How It Works:
The filter checks if the current volume is higher than the average volume (multiplied by a set factor). This helps ensure that the signal isn’t coming from a very quiet market.
User Settings:
Use Volume Filter: Turn this on if you want to ignore signals when there’s not much trading.
Volume MA Period & Volume Multiplier: These settings determine what “normal” volume is and how much higher the current volume must be to count.
c. Multi-Timeframe Trend Filter
What It Is:
This filter looks at a bigger picture by using a moving average (MA) from a higher timeframe (for example, daily charts).
How It Works:
For a bullish (buy) signal, the indicator checks if the price is above this MA.
For a bearish (sell) signal, the price must be below the MA.
User Settings:
Use Multi-Timeframe Trend Filter: Enable or disable this filter.
Higher Timeframe for Trend: Choose which timeframe (like Daily) to use.
Trend MA Type (SMA or EMA) & Trend MA Period: Choose the type of moving average and how many candles to average.
d. Additional Trend Filters (ADX & RSI)
ADX Filter:
What It Is:
ADX stands for Average Directional Index. It measures how strong a trend is.
How It Works:
If the ADX is above a certain threshold, it means the trend is strong.
User Setting:
ADX Threshold: Set the minimum strength the trend should have.
RSI Filter:
What It Is:
RSI (Relative Strength Index) tells you if the price is overbought (too high) or oversold (too low).
How It Works:
For a buy signal, RSI should be low (under a set threshold).
For a sell signal, RSI should be high (above a set threshold).
User Settings:
RSI Buy Threshold & RSI Sell Threshold: These set the levels for buying or selling.
3. How the Final Signal Is Determined
For a signal (buy or sell) to be generated, the indicator first checks if one of the candlestick patterns is present. Then it goes through all these filters (trend, volume, ADX, RSI). Only if everything is in line will it show:
A BUY signal when all bullish conditions are met.
A SELL signal when all bearish conditions are met.
4. Visual Elements on the Chart
Trend MA Line:
A blue line is drawn on your chart showing the moving average from the higher timeframe (if you enable the trend filter). This helps you see the overall direction of the market.
Labels on the Chart:
When a signal is detected, you’ll see:
A BUY label below the candle (green).
A SELL label above the candle (red).
Background Colors:
The chart background might change slightly (green for bullish and red for bearish) to give you a quick visual cue.
Histogram:
At the bottom, there is a histogram that shows +1 for bullish signals, -1 for bearish signals, and 0 when there’s no clear signal.
5. Alerts
Alerts are built into the indicator so you can get a notification when a signal appears. The alert messages are fixed strings, meaning they always say something like “BUY signal on at price .” You can set up these alerts in TradingView to be notified via sound, email, or pop-up.
How to Use and Adjust the Filters
Deciding on Patterns:
You can choose which candlestick patterns you want to detect by toggling the options (e.g., Bullish Engulfing, Hammer, etc.).
Adjusting Adaptive Thresholds:
If you feel that the indicator is too sensitive (or not sensitive enough) during volatile times, adjust the Body Factor, Shadow Factor, and Doji Factor. These change how the indicator recognizes different candle shapes based on market movement.
Volume Filter Settings:
Use Volume Filter:
Turn this on if you want to ignore signals when there’s not enough trading activity.
Adjust the Volume MA Period and Volume Multiplier to change what “normal” volume is for your chart.
Multi-Timeframe Trend Filter Settings:
Choose a higher timeframe (like Daily) to see the bigger picture trend. Select the type of moving average (SMA or EMA) and its period. This filter ensures you only trade in the direction of the overall trend.
ADX & RSI Filters:
ADX:
Adjust the ADX Threshold if you want to change the minimum strength of the trend needed for a signal.
RSI:
Set the RSI Buy Threshold (for oversold conditions) and RSI Sell Threshold (for overbought conditions) to refine when a signal is valid.
Summary
This indicator is like having a smart assistant that not only looks for specific price patterns (candlesticks) but also checks if the overall market conditions are right using several filters. By combining:
Pattern Detection
Adaptive thresholds (based on ATR)
Volume Checks
Multi-Timeframe Trend Analysis
Additional Trend Strength and Overbought/Oversold Indicators (ADX & RSI)
...it helps you decide if it might be a good time to buy or sell. You can customize each part to fit your trading style, and with the built-in alerts, you can be notified when everything lines up.
Feel free to adjust the settings to see how each filter changes the signals on your chart. Experimenting with these will help you learn how the market behaves and how you can best use the indicator for your own strategy!

Sniper TradingSniper Trader Indicator Overview
Sniper Trader is a comprehensive trading indicator designed to assist traders by providing valuable insights and alerting them to key market conditions. The indicator combines several technical analysis tools and provides customizable inputs for different strategies and needs.
Here’s a detailed breakdown of all the components and their functions in the Sniper Trader indicator:
1. MACD (Moving Average Convergence Divergence)
The MACD is a trend-following momentum indicator that helps determine the strength and direction of the current trend. It consists of two lines:
MACD Line (Blue): Calculated by subtracting the long-term EMA (Exponential Moving Average) from the short-term EMA.
Signal Line (Red): The EMA of the MACD line, typically set to 9 periods.
What does it do?
Buy Signal: When the MACD line crosses above the signal line, it generates a buy signal.
Sell Signal: When the MACD line crosses below the signal line, it generates a sell signal.
Zero Line Crossings: Alerts are triggered when the MACD line crosses above or below the zero line.
2. RSI (Relative Strength Index)
The RSI is a momentum oscillator used to identify overbought or oversold conditions in the market.
Overbought Level (Red): The level above which the market might be considered overbought, typically set to 70.
Oversold Level (Green): The level below which the market might be considered oversold, typically set to 30.
What does it do?
Overbought Signal: When the RSI crosses above the overbought level, it’s considered a signal that the asset may be overbought.
Oversold Signal: When the RSI crosses below the oversold level, it’s considered a signal that the asset may be oversold.
3. ATR (Average True Range)
The ATR is a volatility indicator that measures the degree of price movement over a specific period (14 bars in this case). It provides insights into how volatile the market is.
What does it do?
The ATR value is plotted on the chart and provides a reference for potential market volatility. It's used to detect flat zones, where the price may not be moving significantly, potentially indicating a lack of trends.
4. Support and Resistance Zones
The Support and Resistance Zones are drawn by identifying key swing highs and lows over a user-defined look-back period.
Support Zone (Green): Identifies areas where the price has previously bounced upwards.
Resistance Zone (Red): Identifies areas where the price has previously been rejected or reversed.
What does it do?
The indicator uses swing highs and lows to define support and resistance zones and highlights these areas on the chart. This helps traders identify potential price reversal points.
5. Alarm Time
The Alarm Time feature allows you to set a custom time for the indicator to trigger an alarm. The time is based on Eastern Time and can be adjusted directly in the inputs tab.
What does it do?
It triggers an alert at a user-defined time (for example, 4 PM Eastern Time), helping traders close positions or take specific actions at a set time.
6. Market Condition Display
The Market Condition Display shows whether the market is in a Bullish, Bearish, or Flat state based on the MACD line’s position relative to the signal line.
Bullish (Green): The market is in an uptrend.
Bearish (Red): The market is in a downtrend.
Flat (Yellow): The market is in a range or consolidation phase.
7. Table for Key Information
The indicator includes a customizable table that displays the current market condition (Bull, Bear, Flat). The table is placed at a user-defined location (top-left, top-right, bottom-left, bottom-right), and the appearance of the table can be adjusted for text size and color.
8. Background Highlighting
Bullish Reversal: When the MACD line crosses above the signal line, the background is shaded green to highlight the potential for a trend reversal to the upside.
Bearish Reversal: When the MACD line crosses below the signal line, the background is shaded red to highlight the potential for a trend reversal to the downside.
Flat Zone: A flat zone is identified when volatility is low (ATR is below the average), and the background is shaded orange to signal periods of low market movement.
Key Features:
Customizable Time Inputs: Adjust the alarm time based on your local time zone.
User-Friendly Table: Easily view market conditions and adjust display settings.
Comprehensive Alerts: Receive alerts for MACD crossovers, RSI overbought/oversold conditions, flat zones, and the custom alarm time.
Support and Resistance Zones: Drawn automatically based on historical price action.
Trend and Momentum Indicators: Utilize the MACD and RSI for identifying trends and market conditions.
How to Use Sniper Trader:
Set Your Custom Time: Adjust the alarm time to match your trading schedule.
Monitor Market Conditions: Check the table for real-time market condition updates.
Use MACD and RSI Signals: Watch for MACD crossovers and RSI overbought/oversold signals.
Watch for Key Zones: Pay attention to the support and resistance zones and background highlights to identify market turning points.
Set Alerts: Use the built-in alerts to notify you of buy/sell signals or when it’s time to take action at your custom alarm time.

RSI with Bollinger Bands and Buy/Sell SignalsPurpose:
This indicator combines the Relative Strength Index (RSI) with Bollinger Bands to identify overbought and oversold conditions in the market. It also generates buy and sell signals based on the interaction between the RSI and the Bollinger Bands. It is particularly useful for traders looking for opportunities in volatile or trending markets.
How It Works:
RSI (Relative Strength Index):
The RSI measures the magnitude of recent price changes to evaluate whether an asset is overbought (values > 70) or oversold (values < 30).
In this indicator, horizontal lines at levels 70 (overbought) and 30 (oversold) are used as reference points.
Bollinger Bands:
Bollinger Bands are calculated around a smoothed moving average of the RSI. The upper band represents dynamic overbought levels, while the lower band indicates dynamic oversold levels.
These bands automatically adjust their width based on the volatility of the RSI, allowing them to adapt to different market conditions.
Buy and Sell Signals:
Buy Signal: A buy signal is generated when the RSI exceeds both the upper Bollinger Band and the overbought level (70). This suggests that the asset is in an extreme bullish phase.
Sell Signal: A sell signal is generated when the RSI falls below both the lower Bollinger Band and the oversold level (30). This suggests that the asset is in an extreme bearish phase.
Alerts:
The indicator includes automatic alerts to notify you when buy or sell signals are generated. This allows traders to act quickly on new opportunities.
Best Practices:
Confirmation in Lower Timeframes:
Although this indicator is powerful, it is recommended to confirm signals in lower timeframes before making trading decisions. For example:
If you receive a buy signal on a 4-hour chart, check if the RSI and Bollinger Bands on lower timeframes (such as 1 hour or 15 minutes) also show bullish signals.
This reduces the risk of false positives and increases the accuracy of your entries.
Use in Trends:
This indicator works best in markets with clear trends. In sideways or low-volatility markets, signals may be less reliable due to the lack of directional momentum.
Risk Management:
Always use stop-loss and take-profit to protect your positions. Buy and sell signals are just one tool for analysis; they do not guarantee results.
Combination with Other Indicators:
To improve accuracy, consider combining this indicator with others, such as MACD, Stochastic Oscillator, or Japanese candlestick patterns. This can provide additional confirmation before opening a position.
Summary:
The RSI + Bollinger Bands with Buy/Sell Signals indicator is an advanced tool designed to identify entry and exit points in the market based on extreme overbought and oversold conditions. However, to maximize its effectiveness, it is crucial to confirm signals in lower timeframes and use it in combination with other technical analysis tools. With proper risk management and careful interpretation of signals, this indicator can be a valuable ally in your trading strategy.

OI RSI - WuJianDAOOI RSI (Open Interest Relative Strength Index)
Overview: OI RSI is a technical indicator that applies the RSI concept to open interest data.
Key Features:
Traditional vs. OI RSI:
Traditional RSI measures price movements to identify overbought or oversold conditions.
OI RSI computes the relative strength of open interest over a specified period.
Purpose:
Provides insights into market participation and sentiment by evaluating open interest levels.
Application:
Assists traders in detecting potential reversals or confirming trends based on open interest dynamics.

Industry Indices ComparisonA dynamic industry sector performance comparison indicator that helps traders and investors track relative strength across different market sectors in real-time.
- Compares up to 5 industry sector ETFs against a benchmark index (default: SPY)
- Displays key metrics including:
* Performance % over selected timeframe
* Relative performance vs benchmark
* Trend direction (▲ up, ▼ down, − neutral)
* Volume in millions (M) of shares traded
- Configurable timeframes: 1D, 1W, 1M, and 3M comparisons
- Color-coded performance indicators (green for outperformance, red for underperformance)
- Customizable table position and text size for optimal chart placement
The indicator helps identify:
1. Sector rotation patterns through relative performance
2. Leading and lagging sectors vs the broader market
3. Volume trends across different sectors
For traders, if you are considering two equally good setups, then choosing the setup belonging to a currently strong sector could be beneficial.

Uptrick: Zero Lag HMA Trend Suite1. Name and Purpose
Uptrick: Zero Lag HMA Trend Suite is a Pine Version 6 script that builds upon the Hull Moving Average (HMA) to offer an advanced trend analysis tool. Its purpose is to help traders identify trend direction, potential reversals, and overall market momentum with reduced lag compared to traditional moving averages. By combining the HMA with Average True Range (ATR) thresholds, slope-dependent coloring, Volume Weighted Average Price (VWAP) ribbons, and optional reversal signals, the script aims to give a detailed view of price activity in various market environments.
2. Overview
This script begins with the calculation of a Hull Moving Average, a method that blends Weighted Moving Averages in a way designed to cut down on lag while still smoothing out price fluctuations. Next, several enhancements are applied. The script compares current HMA values to previous ones for slope-based coloring, which highlights uptrends and downtrends at a glance. It also plots buy and sell signals when price moves beyond or below thresholds determined by the ATR and the user’s chosen signal multiplier. An optional VWAP ribbon can be shown to confirm bullish or bearish conditions relative to a volume-weighted benchmark. Additionally, the script can plot reversal signals (labeled with B) at points where price crosses back toward the HMA from above or below. Taken together, these elements allow traders to visualize both the short-term momentum and the broader context of how price interacts with volatility and overall market direction.
3. Why These Indicators Have Been Linked Together
The reason the Hull Moving Average, the Average True Range, and the VWAP have been integrated into one script is to tackle multiple facets of market analysis in a single tool. The Zero Lag Hull Moving Average provides a responsive trend line, the ATR offers a measure of volatility that helps distinguish significant price shifts from typical fluctuations, and the VWAP acts as a reference for fair value based on traded volume. By layering all three, the script helps traders avoid the need to juggle multiple separate indicators and offers a holistic perspective. The slope-based coloring focuses on trend direction, the ATR-based thresholds refine possible buy and sell zones, and the VWAP ribbons provide insight into how price stands relative to an important volume-weighted level. The inclusion of up and down signals and reversal B labels further refines entries and exits.
4. Why Use Uptrick: Zero Lag HMA Trend Suite
The Hull Moving Average is already known for reacting more quickly to price changes compared to other moving averages while retaining a degree of smoothness. This suite enhances the basic HMA by showing colored gradients that make it easy to spot trend direction changes, highlighting potential entry or exit points based on volatility-driven thresholds, and optionally layering a volume-based measure of bullish or bearish market sentiment. By relying on a zero lag approach and additional data points, the script caters to those wanting a more responsive method of identifying shifts in market dynamics. The added reversal signals and up or down alerts give traders extra confirmation for potential turning points.
5. How This Extension Improves on the Basic HMA
This extension not only plots the Hull Moving Average but also includes data-driven alerts and visual cues that traditional HMA lines do not provide. First, it offers multi-layered slope coloring, making up or down trends quickly apparent. Second, it uses ATR-based thresholds to pinpoint moments when price may be extending beyond normal volatility, thus generating buy or sell signals. Third, the script introduces an optional VWAP ribbon to indicate whether the market is trading above or below this pivotal volume-weighted benchmark, adding a further confirmation step for bullish or bearish conditions. Finally, it incorporates optional reversal signals labeled with B, indicating points where price might swing back toward the main HMA line.
6. Core Components
The script can be broken down into several primary functions and features.
a. Zero Lag HMA Calculation
Uses two Weighted Moving Averages (half-length and full-length) combined through a smoothing step based on the square root of the chosen length. This approach is designed to reduce lag significantly compared to other moving averages.
b. Slope Detection
Compares current and prior HMA values to determine if the trend is up or down. The slope-based coloring changes between turquoise shades for upward movement and magenta shades for downward movement, making trend direction immediately visible.
c. ATR-Based Thresholding for Up and Down Signals
The script calculates an Average True Range over a user-defined period, then multiplies it by a signal factor to form two bands around the HMA. When price crosses below the lower band, an up (buy) signal appears; when it crosses above the upper band, a down (sell) signal is shown.
d. Reversal Signals (B Labels)
Tracks when price transitions back toward the main HMA from an extreme zone. When enabled, these reversal points are labeled with a B and can help traders see potential turning points or mean-reversion setups.
e. VWAP Bands
An optional Volume Weighted Average Price ribbon that plots above or below the HMA, indicating bullish or bearish conditions relative to a volume-weighted price benchmark. This can also act as a kind of support/ resistance.
7. User Inputs
a. HMA Length
Controls how quickly the moving average responds to price changes. Shorter lengths react faster but can lead to more frequent signals, whereas longer lengths produce smoother lines.
b. Source
Specifies the price input, such as close or an alternative source, for the calculation. This can help align the HMA with specific trading strategies.
c. ATR Length and Signal Multiplier
Defines how the script calculates average volatility and sets thresholds for buy or sell alerts. Adjusting these values can help filter out noise or highlight more aggressive signals.
d. Slope Index
Determines how many bars to look back for detecting slope direction, influencing how sensitive the slope coloring is to small fluctuations.
e. Show Buy and Sell Signals, Reversal Signals, and VWAP
Lets users toggle the display of these features. Turning off certain elements can reduce chart clutter if traders prefer a simpler layout.
8. Calculation Process
The script’s calculation follows a step-by-step approach. It first computes two Weighted Moving Averages of the selected price source, one over half the specified length and one over the full length. It then combines these using 2*wma1 minus wma2 to reduce lag, followed by applying another weighted average using the square root of the length. Simultaneously, it computes the ATR for a user-defined period. By multiplying ATR by the signal multiplier, it establishes upper and lower bands around the HMA, where crossovers generate buy (up) or sell (down) signals. The script can also plot reversal signals (B labels) when price crosses back from these bands in the opposite direction. For the optional VWAP feature, Pine Script’s ta.vwap function is used, and differences between the HMA and VWAP levels determine the color and opacity of the ribbon.
9. Signal Generation and Filtering
The ATR-based thresholds reduce the influence of small, inconsequential price swings. When price falls below the lower band, the script issues an up (buy) signal. If price breaks above the upper band, a down (sell) signal appears. These signals are visible through labels placed near the bars. Reversal signals, labeled with B, can be turned on to help detect when price retraces from an extended area back toward the main HMA line. Traders can disable or enable these signals to match their preferred level of chart detail or risk tolerance.
10. Visualization on the Chart
The Zero HMA Lag Trend Suite aims for visual clarity. The HMA line is plotted multiple times with increasing transparency to create a gradient effect. Turquoise gradients indicate upward slopes, and magenta gradients signify downward slopes. Bar coloring can be configured to align with the slope direction, providing quick insight into current momentum. When enabled, buy or sell labels are placed under or above the bars as price crosses the ATR-defined boundaries. If the reversal option is active, B labels appear around areas where price changes direction. The optional VWAP ribbons form background bands, using distinct coloration to signal whether price is above or below the volume-weighted metric.
11. Market Adaptability
Because the script’s parameters (HMA length, ATR length, signal multiplier, and slope index) are user-configurable, it can adapt to a wide range of markets and timeframes. Intraday traders may prefer a shorter HMA length for quick signals, while swing or position traders might use a longer HMA length to filter out short-lived price changes. The source setting can also be adjusted, allowing for specialized data inputs beyond just close or open values.
12. Risk Management Considerations
The script’s signals and labels are based on past price data and volatility readings, and they do not guarantee profitable outcomes. Sharp market reversals or unforeseen fundamental events can produce false signals. Traders should combine this tool with broader risk management strategies, including stop-loss placement, position sizing, and independent market analyses. The Zero HMA Lag Trend Suite can help highlight potential opportunities, but it should not be relied upon as the sole basis for trade decisions.
13. Combining with Other Tools
Many traders choose to verify signals from the Zero HMA Lag Trend Suite using popular indicators like the Relative Strength Index (RSI), Moving Average Convergence Divergence (MACD), or even simple volume-based metrics to confirm whether a price movement has sufficient momentum. Conventional techniques such as support and resistance levels, chart patterns, or candlestick analysis can also supplement signals generated by the script’s up, down, or reversal B labels.
14. Parameter Customization and Examples
a. Short-Term Day Trading
Using a shorter HMA length (for instance, 9 or 14) and a slightly higher ATR multiplier might provide timely buy and sell signals, though it may also produce more whipsaws in choppy markets.
b. Swing or Position Trading
Selecting a longer HMA length (such as 50 or 100) with a moderate ATR multiplier can help users track more significant and sustained market moves, potentially reducing the effect of minor fluctuations.
c. Multiple Timeframe Blends
Some traders load two versions of the indicator on the same chart, one for short-term signals (with frequent B label reversals) and another for the broader trend direction, aligning entry and exit decisions with the bigger picture.
15. Realistic Expectations
Even though the Hull Moving Average helps minimize lag and the script incorporates volatility-based filters and optional VWAP overlays, it cannot predict future market behavior with complete accuracy. Periods of low liquidity or sudden market shocks can still lead to signals that do not reflect longer-term trends. Frequent parameter review and manual confirmation are advised before executing trades based solely on the script’s outputs.
16. Theoretical Background
The Hull Moving Average formula aims to balance smoothness with reactivity, accomplished by combining Weighted Moving Averages at varying lengths. By subtracting a slower average from a faster one and then applying another smoothing step with the square root of the original length, the HMA is designed to respond more promptly to price changes than typical exponential or simple moving averages. The ATR component, introduced by J. Welles Wilder, calculates the average range of price movement over a user-defined period, allowing the script to assess volatility and adapt signals accordingly. VWAP provides a volume-weighted benchmark that many institutional traders track to gauge fair intraday value.
17. Originality and Uniqueness
Although multiple HMA-based indicators can be found, Uptrick: Zero Lag HMA Trend Suite sets itself apart by merging slope-based coloring, ATR thresholds, VWAP ribbons, up or down labels, and optional reversal signals all in one cohesive platform. This synergy aims to reduce chart clutter while still giving traders a comprehensive look at trend direction, volatility, and volume-based sentiment.
18. Summary
Uptrick: Zero Lag HMA Trend Suite is a specialized trading script designed to highlight potential market trends and reversals with minimal delay. It leverages the Hull Moving Average for an adaptive yet smooth price line, pairs ATR-based thresholds for detecting possible breakouts or dips, and provides VWAP-based ribbons for added volume-weighted context. Traders can further refine their entries and exits by enabling up or down signals and reversal labels (B) where price may revert toward the HMA. Suitable for a wide range of timeframes and instrument types, the script encourages a disciplined approach to trade management and risk control.
19. Disclaimer
This script is provided for informational and educational purposes only. Trading and investing involve significant financial risk, and no indicator can guarantee success under all conditions. Users should practice robust risk management, including the placement of stop losses and position sizing, and should confirm signals with additional analysis tools. The developer of this script assumes no liability for any trading decisions or outcomes resulting from its use.

RSI MACD Combined Color StrategyOverview
This indicator combines RSI and MACD signals to create a powerful visual trading system, inspired by TrendSpider's AI Strategy Coder examples. It colors candles based on the alignment of three key technical conditions, providing clear visual signals for potential trend strength and direction.
Technical Components
Core Conditions
RSI (Relative Strength Index) > 50
Indicates bullish momentum when price is trading above the centerline
Traditional indicator of trend strength
MACD Line > Signal Line
Shows positive momentum
Classic signal for potential upward movement
MACD Line > 0
Confirms bullish territory
Indicates overall positive momentum
Color Coding System
🟢 Green Candles: All three conditions are met
Strongest bullish signal
Suggests high probability trading opportunities
⚪ Grey Candles: One or two conditions are met
Neutral or transitioning market
Suggests caution or waiting for stronger confirmation
🔴 Red Candles: No conditions are met
Bearish signal
Suggests potential downward pressure
How to Use This Indicator
For Entry Signals
Look for transitions from red or grey to green candles
Green candles suggest strong bullish alignment
Consider entering long positions when candles turn green
For Exit Signals
Watch for color transitions from green to grey or red
Consider taking profits when candles change from green to grey
Consider stop losses when candles turn red
Risk Management
Use color transitions as part of your broader strategy
Don't rely solely on color changes for trading decisions
Combine with other technical analysis tools and risk management practices
Customizable Parameters
RSI Length (default: 14)
MACD Fast Length (default: 12)
MACD Slow Length (default: 26)
MACD Signal Length (default: 9)
Best Practices
Use multiple timeframes for confirmation
Look for confluences with support/resistance levels
Consider volume and market context
Start with default settings and adjust based on your trading style
Backtest different parameter combinations
Notes
This indicator works best in trending markets
Grey candles can indicate transition periods
Consider market conditions and volatility when interpreting signals
Credits
Inspired by TrendSpider's AI Strategy Coder examples and adapted for TradingView using Pine Script v5.
Disclaimer
This technical indicator is for informational purposes only. Always conduct your own analysis and consider risk management principles before making trading decisions. Past performance does not guarantee future results.

RShar Seasonal RSISeasonal RSI
This indicator, Seasonal RSI, is designed to enhance trading decisions by combining the **Relative Strength Index (RSI)** with insights derived from historical **seasonality patterns**. It not only calculates RSI but also overlays seasonality data for the current week of the year, providing traders with a more contextualized view of market conditions.
---
### **Key Features**
#### 1. **Relative Strength Index (RSI) Calculation**
- The script calculates the RSI for a user-defined period (`RSI Length`), which is an oscillator used to measure the speed and magnitude of price changes.
- RSI values are plotted on the chart, helping traders identify **overbought** and **oversold** conditions.
- Thresholds for **Overbought** and **Oversold** levels are customizable, with default values of 70 and 30, respectively.
---
#### 2. **Dynamic RSI Coloring Based on Seasonality**
- The color of the RSI line dynamically adjusts based on historical **win rates** for the current week of the year:
- **Bright Green** for win rates > 65%.
- **Green** for win rates between 50-65%.
- **Red** for win rates between 35-50%.
- **Dark Red** for win rates < 35%.
- This feature gives traders a quick visual cue about whether the historical performance of the current week tends to be bullish, neutral, or bearish.
---
#### 3. **Overbought and Oversold Level Visualization**
- Overbought and oversold levels are displayed as dotted horizontal lines on the RSI chart.
- These levels act as visual guides for potential price reversals:
- **Overbought (default 70)**: Indicates potential selling pressure.
- **Oversold (default 30)**: Indicates potential buying pressure.
---
#### 4. **Seasonality Data Integration**
- Historical **seasonality data** is used to analyze price performance patterns for each week of the year:
- **Win Rate**: The percentage of years in which prices closed higher during the current week.
- **Average Weekly Change**: The average price percentage change during the current week over historical data.
- This data provides additional context to RSI readings, helping traders align their strategies with seasonal tendencies.
---
#### 5. **Information Table Overlay**
- A table is displayed in the **top-right corner** of the chart, summarizing seasonality data for the current week:
- **Week Win Rate**: Displays the percentage of historical years where prices rose during this week.
- **Avg Weekly Change**: Shows the average percentage price change for the current week. Positive values are displayed in green, and negative values are shown in red.
- This overlay provides actionable insights without cluttering the chart.
---
### **How It Works**
1. **Seasonality Data**:
- A function (`getSeasonalityForWeek`) fetches or uses predefined mock seasonality data for each week of the year.
- For each week, it calculates:
- The **Win Rate** (percentage of years with positive performance).
- The **Mean Change** (average price percentage change).
2. **RSI Plot**:
- The RSI line is plotted on the chart.
- The line's color is determined by the win rate for the current week, providing a visual representation of historical performance trends.
3. **Threshold Visualization**:
- Horizontal lines for overbought and oversold levels are drawn to assist in identifying potential reversal points.
4. **Information Table**:
- The table summarizes the current week's seasonality data for quick reference, helping traders make data-driven decisions.
---
### **Use Cases**
- **Short-Term Traders**:
Use the dynamic RSI colors and seasonality table to align short-term trades with historical patterns of weekly performance.
- **Swing Traders**:
Identify whether a stock or market is in an overbought/oversold condition while considering the seasonal tendency for the week.
- **Contextual Decision-Making**:
Combine traditional RSI signals with historical data to reduce false signals and improve timing.
---
### **Limitations**
- The script uses **mock seasonality data** in its default state. To make it fully functional, replace the mock data with actual historical performance metrics for your specific ticker or market.
- The indicator does not fetch real-time external data due to Pine Script’s limitations, so all seasonality data must be manually updated or hardcoded.
---
This indicator provides a powerful way to combine technical analysis with historical trends, offering a unique edge to traders by adding seasonal context to RSI signals.

RSI + ADX + ATR 18-01-25Combining RSI (Relative Strength Index), ADX (Average Directional Index), and ATR (Average True Range) creates a synergistic approach to technical analysis. This powerful trio covers momentum, trend strength, and volatility, providing comprehensive insights into market conditions. Here's a deeper exploration of their combined results:
1. Momentum Assessment with RSI
Purpose: RSI measures the speed and magnitude of recent price changes to determine overbought or oversold levels.
Benefit in Combination:
When RSI indicates overbought (above 70) or oversold (below 30) levels, it signals a potential reversal or correction.
However, these signals can be false in strongly trending markets, which is why ADX is used alongside it.
2. Trend Strength Confirmation with ADX
Purpose: ADX confirms the presence and strength of a trend.
Benefit in Combination:
If RSI shows a potential reversal but ADX indicates a strong trend (above 25), the trend is likely to continue, and RSI signals may need to be approached with caution.
Conversely, if ADX is below 20 (weak trend), RSI signals are more likely to indicate genuine reversals, as the market lacks a strong directional push.
3. Volatility Analysis with ATR
Purpose: ATR evaluates the level of price volatility.
Benefit in Combination:
High ATR values indicate volatile conditions where prices can move significantly; this helps in setting wider stop-loss levels to avoid premature exits.
Low ATR values suggest quieter markets, where tighter stop-losses and profit targets are more suitable.

StockInfo ManualScript Description:
The StockInfo Manual is designed to display detailed stock information directly on the chart for the selected symbol. It processes user-provided input data, including
stock symbols
Industries
Relative Strength (RS) values
Band information
Key Features:
1. Symbol-Specific Data Display: Displays information only for the current chart symbol.
2. Customizable Table: Adjust the table's position, text size, colors, and headers to match your preferences.
3. Low RS/Band Conditions: Highlights critical metrics (RS < 50 or Band < 6) with a red background for quick visual cues.
4. Toggle Information: Choose to show or hide RS, Band, and Industry columns based on your needs.
How to Use the Script:
1. Use any platform (ex: chartsmaze) to get Industry,RS and Band information of any Stock. Prepare the data as separate column of excel
2. Configure Inputs:
- Stock Symbols (`Stock`): Enter a comma-separated list of stock symbols (e.g.,
NSE:ABDL,
NSE:ABFRL,
NSE:ABREL,
NSE:ABSLAMC,
NSE:ACC,
NSE:ACE,
- Industries (`Industry`): Provide a comma-separated list of industries for the stocks (e.g., 103-Brewerie,
109-Retail-D,
92-Paper & ,
19-Asset Ma,
62-Cement,
58-Industri,
- Relative Strength (`RS`): Input RS values for each stock (e.g.,
83,
52,
51,
81,
23,
59,
- Band Information (`Band`): Specify Band values for each stock. Use "No Band" if 10,
No Band,
20,
20,
No Band,
20,
3. Customize the Table:
-Display Options: Toggle the visibility of `RS`, `Band`, and `Industry` using the input checkboxes.
-Position and Appearance: Choose the table's position on the chart (e.g., top-right, bottom-center). Customize text size, background colors, header display, and other visual elements.
4. Interpret the Table:
- The table will dynamically display information for the current chart symbol only.
- If the `RS` is below 50 or the Band is below 6, the corresponding row is highlighted with a red background for immediate attention.
One need to enter details at least weekly for a correct result

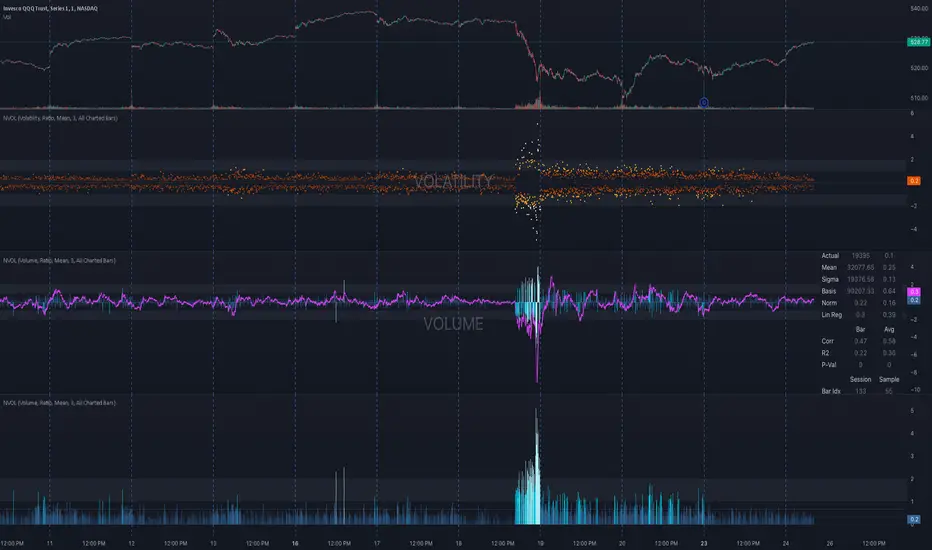
NVOL Normalized Volume & VolatilityOVERVIEW
Plots a normalized volume (or volatility) relative to a given bar's typical value across all charted sessions. The concept is similar to Relative Volume (RVOL) and Average True Range (ATR), but rather than using a moving average, this script uses bar data from previous sessions to more accurately separate what's normal from what's anomalous. Compatible on all timeframes and symbols.
Having volume and volatility processed within a single indicator not only allows you to toggle between the two for a consistent data display, it also allows you to measure how correlated they are. These measurements are available in the data table.
DATA & MATH
The core formula used to normalize each bar is:
( Value / Basis ) × Scale
Value
The current bar's volume or volatility (see INPUTS section). When set to volume, it's exactly what you would expect (the volume of the bar). When set to volatility, it's the bar's range (high - low).
Basis
A statistical threshold (Mean, Median, or Q3) plus a Sigma multiple (standard deviations). The default is set to the Mean + Sigma × 3 , which represents 99.7% of data in a normal distribution. The values are derived from the current bar's equivalent in other sessions. For example, if the current bar time is 9:30 AM, all previous 9:30 AM bars would be used to get the Mean and Sigma. Thus Mean + Sigma × 3 would represent the Normal Bar Vol at 9:30 AM.
Scale
Depends on the Normalize setting, where it is 1 when set to Ratio, and 100 when set to Percent. This simply determines the plot's scale (ie. 0 to 1 vs. 0 to 100).
INPUTS
While the default configuration is recommended for a majority of use cases (see BEST PRACTICES), settings should be adjusted so most of the Normalized Plot and Linear Regression are below the Signal Zone. Only the most extreme values should exceed this area.
Normalize
Allows you to specify what should be normalized (Volume or Volatility) and how it should be measured (as a Ratio or Percentage). This sets the value and scale in the core formula.
Basis
Specifies the statistical threshold (Mean, Median, or Q3) and how many standard deviations should be added to it (Sigma). This is the basis in the core formula.
Mean is the sum of values divided by the quantity of values. It's what most people think of when they say "average."
Median is the middle value, where 50% of the data will be lower and 50% will be higher.
Q3 is short for Third Quartile, where 75% of the data will be lower and 25% will be higher (think three quarters).
Sample
Determines the maximum sample size.
All Charted Bars is the default and recommended option, and ignores the adjacent lookback number.
Lookback is not recommended, but it is available for comparisons. It uses the adjacent lookback number and is likely to produce unreliable results outside a very specific context that is not suitable for most traders. Normalization is not a moving average. Unless you have a good reason to limit the sample size, do not use this option and instead use All Charted Bars .
Show Vol. name on plot
Overlays "VOLUME" or "VOLATILITY" on the plot (whichever you've selected).
Lin. Reg.
Polynomial regressions are great for capturing non-linear patterns in data. TradingView offers a "linear regression curve", which this script uses as a substitute. If you're unfamiliar with either term, think of this like a better moving average.
You're able to specify the color, length, and multiple (how much to amplify the value). The linear regression derives its value from the normalized values.
Norm. Val.
This is the color of the normalized value of the current bar (see DATA & MATH section). You're able to specify the default, within signal, and beyond signal colors. As well as the plot style.
Fade in colors between zero and the signal
Programmatically adjust the opacity of the primary plot color based on it's normalized value. When enabled, values equal to 0 will be fully transparent, become more opaque as they move away from 0, and be fully opaque at the signal. Adjusting opacity in this way helps make difference more obvious.
Plot relative to bar direction
If enabled, the normalized value will be multiplied by -1 when a bar's open is greater than the bar's close, mirroring price direction.
Technically volume and volatility are directionless. Meaning there's really no such thing as buy volume, sell volume, positive volatility, or negative volatility. There is just volume (1 buy = 1 sell = 1 volume) and volatility (high - low). Even so, visually reflecting the net effect of pricing pressure can still be useful. That's all this setting does.
Sig. Zone
Signal zones make identifying extremes easier. They do not signal if you should buy or sell, only that the current measurement is beyond what's normal. You are able to adjust the color and bounds of the zone.
Int. Levels
Interim levels can be useful when you want to visually bracket values into high / medium / low. These levels can have a value anywhere between 0 and 1. They will automatically be multiplied by 100 when the scale is set to Percent.
Zero Line
This setting allows you to specify the visibility of the zero line to best suit your trading style.
Volume & Volatility Stats
Displays a table of core values for both volume and volatility. Specifically the actual value, threshold (mean, median, or Q3), sigma (standard deviation), basis, normalized value, and linear regression.
Correlation Stats
Displays a table of correlation statistics for the current bar, as well as the data set average. Specifically the coefficient, R2, and P-Value.
Indices & Sample Size
Displays a table of mixed data. Specifically the current bar's index within the session, the current bar's index within the sample, and the sample size used to normalize the current bar's value.
BEST PRACTICES
NVOL can tell you what's normal for 9:30 AM. RVOL and ATR can only tell you if the current value is higher or lower than a moving average.
In a normal distribution (bell curve) 99.7% of data occurs within 3 standard deviations of the mean. This is why the default basis is set to "Mean, 3"; it includes the typical day-to-day fluctuations, better contextualizing what's actually normal, minimizing false positives.
This means a ratio value greater than 1 only occurs 0.3% of the time. A series of these values warrants your attention. Which is why the default signal zone is between 1 and 2. Ratios beyond 2 would be considered extreme with the default settings.
Inversely, ratio values less than 1 (the normal daily fluctuations) also tell a story. We should expect most values to occur around the middle 3rd, which is why interim levels default to 0.33 and 0.66, visually simplifying a given move's participation. These can be set to whatever you like and only serve as visual aids for your specific trading style.
It's worth noting that the linear regression oscillates when plotted directionally, which can help clarify short term move exhaustion and continuation. Akin to a relative strength index (RSI), it may be used to inform a trading decision, but it should not be the only factor.
AI indicatorThis script is a trading indicator designed for future trading signals on the TradingView platform. It uses a combination of the Relative Strength Index (RSI) and a Simple Moving Average (SMA) to generate buy and sell signals. Here's a breakdown of its components and logic:
1. Inputs
The script includes configurable inputs to make it adaptable for different market conditions:
RSI Length: Determines the number of periods for calculating RSI. Default is 14.
RSI Overbought Level: Signals when RSI is above this level (default 70), indicating potential overbought conditions.
RSI Oversold Level: Signals when RSI is below this level (default 30), indicating potential oversold conditions.
Moving Average Length: Defines the SMA length used to confirm price trends (default 50).
2. Indicators Used
RSI (Relative Strength Index):
Measures the speed and change of price movements.
A value above 70 typically indicates overbought conditions.
A value below 30 typically indicates oversold conditions.
SMA (Simple Moving Average):
Used to smooth price data and identify trends.
Price above the SMA suggests an uptrend, while price below suggests a downtrend.
3. Buy and Sell Signal Logic
Buy Condition:
The RSI value is below the oversold level (e.g., 30), indicating the market might be undervalued.
The current price is above the SMA, confirming an uptrend.
Sell Condition:
The RSI value is above the overbought level (e.g., 70), indicating the market might be overvalued.
The current price is below the SMA, confirming a downtrend.
These conditions ensure that trades align with market trends, reducing false signals.
4. Visual Features
Buy Signals: Displayed as green labels (plotshape) below the price bars when the buy condition is met.
Sell Signals: Displayed as red labels (plotshape) above the price bars when the sell condition is met.
Moving Average Line: A blue line (plot) added to the chart to visualize the SMA trend.
5. How It Works
When the buy condition is true (RSI < 30 and price > SMA), a green label appears below the corresponding price bar.
When the sell condition is true (RSI > 70 and price < SMA), a red label appears above the corresponding price bar.
The blue SMA line helps to visualize the overall trend and acts as confirmation for signals.
6. Advantages
Combines Momentum and Trend Analysis:
RSI identifies overbought/oversold conditions.
SMA confirms whether the market is trending up or down.
Simple Yet Effective:
Reduces noise by using well-established indicators.
Easy to interpret for beginners and experienced traders alike.
Customizable:
Parameters like RSI length, oversold/overbought levels, and SMA length can be adjusted to fit different assets or timeframes.
7. Limitations
Lagging Indicator: SMA is a lagging indicator, so it may not capture rapid market reversals quickly.
Not Foolproof: No trading indicator can guarantee 100% accuracy. False signals can occur in choppy or sideways markets.
Needs Volume Confirmation: The script does not consider trading volume, which could enhance signal reliability.
8. How to Use It
Copy the script into TradingView's Pine Editor.
Save and add it to your chart.
Adjust the RSI and SMA parameters to suit your preferred asset and timeframe.
Look for buy signals (green labels) in uptrends and sell signals (red labels) in downtrends.

[blackcat] L2 Waveband Trading█ OVERVIEW
The Waveband Trading script calculates trading signals based on a modified Relative Strength Index (RSI)-like system combined with specific price action criteria. It plots two lines representing different smoothed RSI-like indicators and marks potential buying opportunities labeled as "S" for stronger trends and "B" for weaker but still favorable ones.
█ LOGICAL FRAMEWORK
The script begins by defining the waveband_trading_signals function which computes RSI-like metrics and determines buy signals under certain conditions. The main sections include input parameter definitions, function calls, data processing within the function, and plot commands for visual representation. Data flows from historical OHLCV data to various technical computations like EMAs and SMAs before being evaluated against user-defined thresholds to generate trade signals.
█ CUSTOM FUNCTIONS
Waveband Trading Signals:
• Purpose: Computes waveband trading signals using a customized version of the RSI indicator.
• Parameters:
— overboughtLevel: Threshold level indicating market overbought condition.
— oversoldLevel: Threshold level indicating market oversold condition.
— strongHoldLevel: Strong hold condition threshold between neutral and overbought states.
— moderateHoldLevel: Moderate hold condition threshold below strong hold level.
• [b>Returns: A tuple containing:
— k: Smoothed RSI-like metric.
— d: Further smoothed version of 'k'.
— buySignalStrong: Boolean indicating a strong trend buy signal.
— buySignalWeak: Boolean indicating a weak but promising buy signal.
█ KEY POINTS AND TECHNIQUES
• Utilizes EMA and SMA functions to smooth out price variations effectively.
• Employs crossover logic between fast ('k') and slow ('d') indicators to identify entry points.
• Incorporates volume checks ensuring increasing interest in trades aligns with upwards momentum.
• Leverages predefined threshold levels allowing flexibility to adapt to varying market conditions.
• Uses the new labeling feature ( label.new ) introduced in Pine Script v5 for marking significant chart events visually.
█ EXTENDED KNOWLEDGE AND APPLICATIONS
Potential enhancements could involve incorporating additional filters such as MACD crossovers or Fibonacci retracement levels alongside optimizing current conditions via backtesting. This technique might also prove useful in other strategies requiring robust confirmation methods beyond simple price action; alternatively, adapting it into a more automated form for execution on exchanges offering API access. Understanding key functionalities like relative strength assessment, smoothed averaging techniques, and conditional buy/sell rules enriches one’s toolkit when developing complex trading algorithms tailored specifically toward personal investment philosophies.

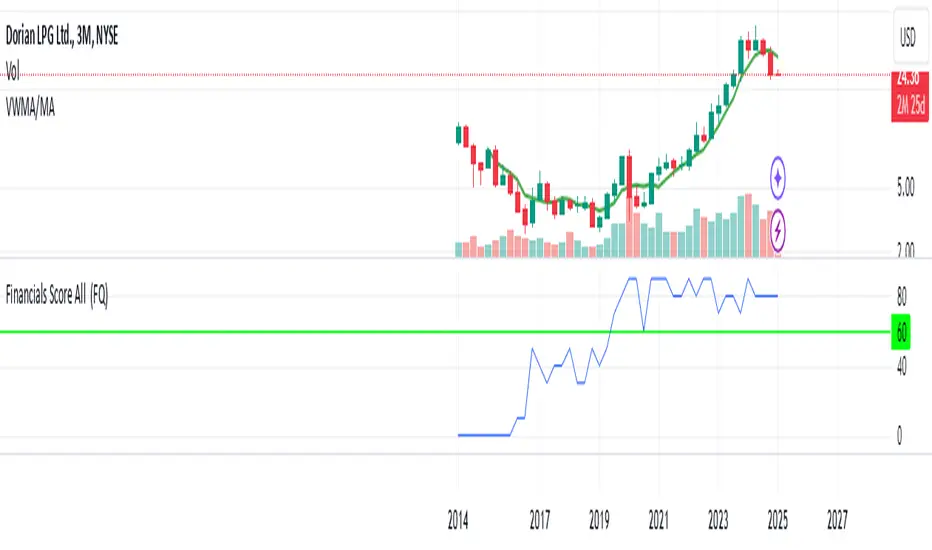
Financials Score All Description of the "Financials Score All" Script
This Pine Script calculates a financial score for a specific stock, based on various financial metrics. The purpose is to provide a comprehensive numerical score that reflects the financial health of the stock. The score is calculated using multiple financial indicators, including profitability, valuation, debt management, and liquidity. Here’s a breakdown of what each part of the script does:
period = input.string('FQ', 'Period', options= )
FQ refers to Quarterly financial data.
FY refers to Fiscal Year financial data.
Financial Metrics:
The script uses various financial metrics to calculate the score. These are obtained via request.financial, which retrieves financial data for the stock from TradingView's database. Below are the metrics used:
opmar (Operating Margin): Measures the company's profitability as a percentage of revenue.
eps (Earnings Per Share): Represents the portion of a company's profit allocated to each outstanding share.
eps_ttm (Earnings Per Share – Trailing Twelve Months): EPS over the most recent 12 months.
pe_ratio (Price-to-Earnings Ratio): A measure of the price investors are willing to pay for a stock relative to its earnings.
pb_ratio (Price-to-Book Ratio): A valuation ratio comparing a company’s market value to its book value.
de_ratio (Debt-to-Equity Ratio): A measure of the company’s financial leverage, showing how much debt it has compared to shareholders' equity.
roe_pb (Return on Equity Adjusted to Book): Measures the company's profitability relative to its book value.
fcf_per_share (Free Cash Flow per Share): Represents the free cash flow available for dividends, debt reduction, or reinvestment, per share.
pfcf_ratio (Price-to-Free-Cash-Flow Ratio): A measure comparing a company’s market value to its free cash flow.
current_ratio (Current Ratio): A liquidity ratio that measures a company's ability to pay short-term obligations with its current assets.
RSI Calculation:
The script calculates the Relative Strength Index (RSI) for the stock using an 8-period lookback:
rsi = ta.rsi(close, 8)
Score Calculation:
The script calculates a total score by adding points based on the values of the financial metrics. Each metric is checked against a condition, and if the condition is met, the score is incremented:
If the Operating Margin (opmar) is greater than 20, the score is incremented by 20 points.
If Earnings Per Share (EPS) is positive, 10 points are added.
If the P/E ratio is between 0 and 20, 10 points are added.
If the P/B ratio is less than 3, 10 points are added.
If the Debt-to-Equity ratio is less than 0.8, 10 points are added.
If the Return on Equity Adjusted to Book is greater than 10, 10 points are added.
If the P/FCF ratio is between 0 and 15, 10 points are added.
If the Current Ratio is greater than 1.61, 10 points are added.
If the RSI is less than 35, 10 points are added.
The score is accumulated based on these conditions and stored in the total_score variable.
Displaying the Total Score:
Finally, the total score is plotted on the chart:
Summary of How It Works:
This script calculates a financial score for a stock using a variety of financial indicators. Each metric has a threshold, and when the stock meets certain criteria (for example, a good operating margin, a healthy debt-to-equity ratio, or a low P/E ratio), points are added to the overall score. The result is a single numerical value that reflects the financial health of the stock.
This score can help traders or investors identify companies with strong financials, or serve as a comparison tool between different stocks based on their financial health.
Generally >60 is the best stocks for med and long term trades
Max The Minner: RSI Bands with Min/Max [by Oberlunar]This Pine Script, titled "Max The Minner: RSI Bands with Min/Max " is a technical indicator designed to visualize RSI-based dynamic bands with local minimum and maximum levels on a chosen timeframe. The script incorporates user-configurable parameters for RSI thresholds, resolution, and color settings, providing traders with a highly customizable tool for analyzing price behavior in relation to overbought and oversold conditions.
Core Functionality
The script begins by calculating the RSI (Relative Strength Index) using user-defined inputs for overbought and oversold levels, the RSI length, and the resolution (default set to daily). The RSI is computed through an exponential moving average (EMA) approach that smooths the upward and downward price movements, creating adaptive upper (ub) and lower (lb) bands based on the overbought and oversold thresholds.
These bands are then dynamically adjusted based on the current price (src) and the EMA calculations. The upper band (ub) represents a potential resistance zone aligned with the RSI overbought level, while the lower band (lb) represents a support zone aligned with the RSI oversold level. The script employs additional calculations to ensure the adaptive nature of these bands, depending on whether the RSI is pushing higher or lower relative to its thresholds.
Local Minima and Maxima
A key feature of the indicator is its ability to track and update local minima and maxima based on the chosen timeframe. The script uses a buffer system that refreshes these levels every three bars to smooth out noise and avoid excessive sensitivity to short-term fluctuations. These local extrema (localMin and localMax) are retrieved from the lower and upper prices of the selected timeframe and act as dynamic benchmarks for evaluating the RSI bands.
Conditional Logic
The script includes conditional logic to determine when the RSI bands intersect with or approach the local maxima or minima. For example:
The upper band (ub) is plotted only if it is below the local maximum, suggesting that price may encounter resistance.
Similarly, the lower band (lb) is plotted only if it is above the local minimum, indicating potential support.
This logic ensures that the bands are contextually relevant to the prevailing market structure, rather than being static overlays.
Visualization
The RSI bands and local extrema are plotted on the chart using color-coded lines, with transparency adjustable through user inputs. The upper band and local maximum are linked with a fill area, visually representing the resistance zone. Similarly, the lower band and local minimum are filled to highlight the support zone. These fills provide a clear depiction of price boundaries, making it easier for traders to spot key levels.
Additionally, the script marks breakout conditions. If the price exceeds the local maximum, a label is plotted at the breakout point with a distinctive style and color. Similarly, a breakout below the local minimum is labeled, providing a visual cue for significant price movements.
Customization
The script offers extensive customization options for both functionality and appearance:
Users can define the overbought and oversold levels for RSI, along with the RSI length and the resolution (timeframe).
Colors for the upper and lower bands, along with transparency (alpha) levels, can be adjusted, allowing for seamless integration with different chart styles.
The periodicity of the local minima and maxima updates is hardcoded to three bars but could be further parameterized for greater flexibility.
This indicator is particularly useful for traders who rely on RSI-based strategies and need a dynamic representation of overbought and oversold conditions in conjunction with local price extremes. By combining RSI bands with the context provided by local minima and maxima, it allows traders to:
Identify potential support and resistance levels.
Visualize price behavior relative to RSI thresholds.
Spot breakout opportunities when price exceeds predefined levels.

Advanced Divergence IndicatorAdvanced Divergence Indicator
Unlock the full potential of your trading strategy with the Advanced Divergence Indicator, a powerful tool designed to identify and analyze bullish and bearish divergences using multiple technical indicators. Whether you're a seasoned trader or just starting out, this indicator provides clear, actionable signals to help you make informed trading decisions.
What It Does
The Advanced Divergence Indicator detects divergences between price movements and key technical indicators, specifically the Relative Strength Index (RSI) and On-Balance Volume (OBV). Divergence occurs when the price trends in one direction while the indicator trends in the opposite direction, signaling potential reversals or continuations in the market.
Key Features
Multi-Indicator Analysis
RSI Divergence: Identifies bullish and bearish divergences using the RSI, helping you spot potential reversals based on momentum.
OBV Divergence: Utilizes OBV to detect divergences related to volume flow, providing insights into the strength behind price movements.
Bullish and Bearish Signals
Bullish Divergence: Signals when indicators show higher lows while the price forms lower lows, suggesting a potential upward reversal.
Bearish Divergence: Alerts when indicators display lower highs while the price creates higher highs, indicating a possible downward reversal.
Signal Strength Classification
Standard Signals: Represent typical divergence occurrences, marked with green (bullish) and red (bearish) labels.
Strong Signals: Highlighted with yellow (strong bullish) and blue (strong bearish) labels when divergences coincide with overbought or oversold conditions, enhancing signal reliability.
Customizable Settings
Indicator Selection: Choose to enable RSI, OBV, or both based on your trading preferences.
Pivot Points: Adjust the number of bars left and right to fine-tune pivot detection for more accurate divergence identification.
Range Configuration: Set minimum and maximum bar ranges to control the sensitivity of divergence detection, suitable for different timeframes and trading styles.
Noise Cancellation: Reduce false signals by enabling noise filtering, ensuring that only significant divergences are highlighted.
Visual Clarity
Color-Coded Labels: Easily distinguish between different types of divergences with intuitive color codes—green for bullish, red for bearish, yellow for strong bullish, and blue for strong bearish signals.
Clean Chart Display: The indicator overlays seamlessly on your chart without clutter, ensuring that signals are easily identifiable without distracting from price action.
Real-Time Alerts
Custom Alert Conditions: Receive instant notifications for bullish and bearish divergences, enabling you to act promptly on potential trading opportunities.
Combined Alerts: Get alerts for either bullish or bearish signals, or both, based on your selected criteria.
How to Use
Add the Indicator to Your Chart
Apply the Advanced Divergence Indicator to your desired chart and timeframe.
Configure Settings
Select Indicators: Choose to enable RSI, OBV, or both under the "Indicator Settings" group.
Adjust Parameters: Customize RSI length, pivot points, and divergence ranges to match your trading strategy and the specific asset you are analyzing.
Enable Noise Cancellation: Activate this feature to filter out minor divergences and focus on more significant signals.
Interpret the Signals
Bullish Signals: Look for green or yellow labels below the price bars indicating potential upward reversals.
Bearish Signals: Identify red or blue labels above the price bars signaling possible downward reversals.
Strong Signals: Pay special attention to yellow and blue labels as they denote stronger divergences with higher reliability.
Set Up Alerts
Configure alert conditions within the indicator to receive real-time notifications when bullish or bearish divergences are detected, ensuring you never miss a trading opportunity.
Why Choose Advanced Divergence Indicator
Comprehensive Analysis : By combining RSI and OBV, the indicator provides a more robust analysis compared to single-indicator tools, enhancing the accuracy of divergence detection.
Flexibility : Highly customizable settings allow traders to tailor the indicator to their unique strategies and market conditions.
User-Friendly : Clear labels and color codes make it easy for traders of all levels to understand and act on the signals.
Reliability : Strong signal classification and noise cancellation features help reduce false positives, providing more trustworthy trading signals.

LibraryDivergenceV6LibraryDivergenceV6
Enhance your trading strategies with LibraryDivergenceV6, a comprehensive Pine Script library designed to simplify and optimize the detection of bullish and bearish divergences across multiple technical indicators. Whether you're developing your own indicators or seeking to incorporate robust divergence analysis into your trading systems, this library provides the essential tools and functions to accurately identify potential market reversals and continuations.
Overview
LibraryDivergenceV6 offers a suite of functions that detect divergences between price movements and key technical indicators such as the Relative Strength Index (RSI) and On-Balance Volume (OBV). By automating the complex calculations involved in divergence detection, this library enables traders and developers to implement reliable and customizable divergence strategies with ease.
Key Features
Comprehensive Divergence Detection
Bullish Divergence: Identifies instances where the indicator forms higher lows while the price forms lower lows, signaling potential upward reversals.
Bearish Divergence: Detects situations where the indicator creates lower highs while the price forms higher highs, indicating possible downward reversals.
Overbought and Oversold Conditions: Differentiates between standard and strong divergences by considering overbought and oversold levels, enhancing signal reliability.
Multi-Indicator Support
RSI (Relative Strength Index): Analyze momentum-based divergences to spot potential trend reversals.
OBV (On-Balance Volume): Incorporate volume flow into divergence analysis for a more comprehensive market perspective.
Customizable Parameters
Pivot Points Configuration: Adjust the number of bars to the left and right for pivot detection, allowing fine-tuning based on different timeframes and trading styles.
Range Settings: Define minimum and maximum bar ranges to control the sensitivity of divergence detection, reducing false signals.
Noise Cancellation: Enable or disable noise filtering to focus on significant divergences and minimize minor fluctuations.
Flexible Usage
Exported Functions: Easily integrate divergence detection into your custom indicators or trading strategies with exported functions such as DivergenceBull, DivergenceBear, DivergenceBullOversold, and DivergenceBearOverbought.
Occurrence Handling: Specify which occurrence of a divergence to consider (e.g., most recent, previous) for precise analysis.
Optimized Performance
Efficient Calculations: Designed to handle multiple occurrences and pivot points without compromising script performance.
Line Management: Automatically creates and deletes trend lines based on divergence conditions, ensuring a clean and uncluttered chart display.

GocchiMulti-Indicator: RSI & Moving Averages
This versatile TradingView indicator combines two essential tools for technical analysis—Relative Strength Index (RSI) and Moving Averages (MAs)—into one comprehensive solution. It is designed for traders seeking flexibility, customization, and efficiency in their charting experience.
Features:
Relative Strength Index (RSI):
Customizable RSI length.
Adjustable overbought and oversold levels.
Selectable source input (e.g., close, open, high, low).
Visual levels for overbought and oversold zones, aiding in quick trend and momentum identification.
Three Moving Averages:
Three independently customizable moving averages.
Options for Simple Moving Average (SMA) or Exponential Moving Average (EMA) for each line.
Adjustable lengths for short-, medium-, and long-term trend tracking.
Visual Enhancements:
Clear, color-coded plots for RSI and each moving average.
Overbought and oversold zones are highlighted with horizontal dotted lines.
Alerts:
Get notified when RSI crosses above the overbought level or below the oversold level.
Alerts help traders stay on top of potential market reversals or breakout opportunities.
Use Cases:
RSI Analysis: Spot overbought or oversold conditions to identify potential reversals.
Trend Following: Use moving averages to confirm trends or identify crossovers for potential entry and exit points.
Custom Strategies: Tailor the settings to fit specific trading styles, such as scalping, swing trading, or long-term investing.
This all-in-one indicator streamlines your analysis by reducing the need for multiple overlays, making your charts cleaner and more actionable. Whether you're a novice or an experienced trader, this tool provides the flexibility and insights you need to succeed in any market condition.

Money Flow ExtendedMoney Flow Extended (MF)
Definition
The Money Flow Extended (MF) indicator brings together the functionality of the Money Flow Index indicator (MFI) , a tool created by Gene Quong and Avrum Soudack and used in technical analysis for measuring buying and selling pressure, and The Relative Strength Index (RSI) , a well versed momentum based oscillator created by J.Welles Wilder Jr., which is used to measure the speed (velocity) as well as the change (magnitude) of directional price movements.
History
As the Money Flow Index (MFI) is quite similar to The Relative Strength Index (RSI), essentially the RSI with the added aspect of volume, adding a Moving Average, divergence calculation, oversold and overbought gradients, facilitates the transition from RSI, making the use of MFI pretty similar.
What to look for
Overbought/Oversold
When momentum and price rise fast enough, at a high enough level, eventual the security will be considered overbought. The opposite is also true. When price and momentum fall far enough, they can be considered oversold. Traditional overbought territory starts above 80 and oversold territory starts below 20. These values are subjective however, and a technical analyst can set whichever thresholds they choose.
Divergence
MF Divergence occurs when there is a difference between what the price action is indicating and what MF is indicating. These differences can be interpreted as an impending reversal. Specifically, there are two types of divergences, bearish and bullish.
Bullish MFI Divergence – When price makes a new low but MF makes a higher low.
Bearish MFI Divergence – When price makes a new high but MF makes a lower high.
Failure Swings
Failure swings are another occurrence which can lead to a price reversal. One thing to keep in mind about failure swings is that they are completely independent of price and rely solely on MF. Failure swings consist of four steps and are considered to be either Bullish (buying opportunity) or Bearish (selling opportunity).
Bullish Failure Swing
MF drops below 20 (considered oversold).
MF bounces back above 20.
MF pulls back but remains above 20 (remains above oversold)
MF breaks out above its previous high.
Bearish Failure Swing
MF rises above 80 (considered overbought)
MF drops back below 80
MF rises slightly but remains below 80 (remains below overbought)
MF drops lower than its previous low.
Summary
The Money Flow Extended (MF) can be a very valuable technical analysis tool. Of course, MF should not be used alone as the sole source for a trader’s signals or setups. MF can be combined with additional indicators or chart pattern analysis to increase its effectiveness.
Inputs
Length
The time period to be used in calculating the MF. 14 is the default.
Pivot Loopback
After how many bars you want the divergence to show, on the scale of 1-5. 5 is the default.
Calculate Divergence
Calculating divergences is needed in order for divergence alerts to fire.
Moving Average section
You can learn more about the inputs in the "Moving Average" section in this Help Center article .
Style
MF
Can toggle the visibility of the MF as well as the visibility of a price line showing the actual current value of the MF. Can also select the MF Line's color, line thickness and visual style.
MF-based MA
Can toggle the visibility of the MF-based MA as well as the visibility of a price line showing the actual current MA value. Can also select its color, line thickness and line style.
MF Upper Band
Can toggle the visibility of the Upper Band as well as sets the boundary, on the scale of 1-100, for the Upper Band (80 is the default). The color, line thickness and line style can also be determined.
MF Middle Band
Can toggle the visibility of the Middle Band as well as sets the boundary, on the scale of 1-100, for the Middle Band (50 is the default). The color, line thickness and line style can also be determined.
MF Lower Band
Can toggle the visibility of the Lower Band as well as sets the boundary, on the scale of 1-100, for the Lower Band (20 is the default). The color, line thickness and line style can also be determined.
MF Background Fill
Toggles the visibility of a Background color within the MF's boundaries. Can also change the Color itself as well as the opacity.
Overbought Gradient Fill
Can toggle the visibility of the Overbought Gradient Fill. Can also select its colors combination.
Oversold Gradient Fill
Can toggle the visibility of the Oversold Gradient Fill. Can also select its colors combination.
Precision
Sets the number of decimal places to be left on the indicator's value before rounding up. The higher this number, the more decimal points will be on the indicator's value.
